
AI Financial Reporting Software
Multidimensional reporting and analytics
Slice, extract, and present your data just how you like it. Report in real time across all entities, and uncover new insights with AI.

Create reports that match your business logic
Custom report designs
Dive into granular transaction analysis and tailored views of your financial data across multiple books, all powered by a real-time general ledger. Create department-specific R&D expense reports, conduct month-over-month vendor comparisons, and spot missing accruals, ensure prepaid amortization accuracy, and accelerate close management without manual checks.
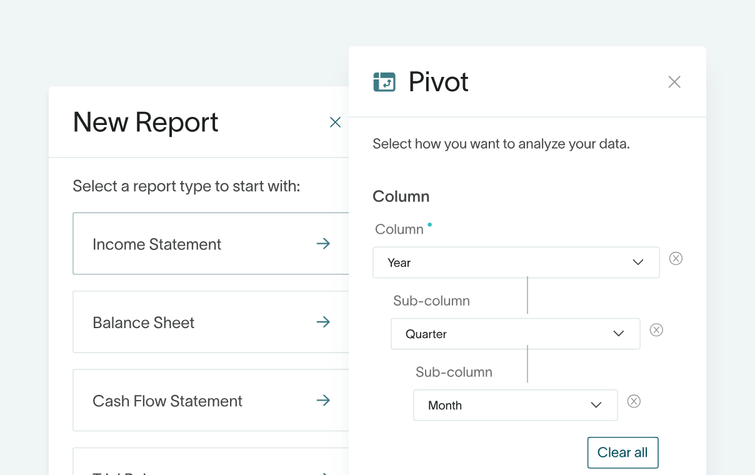
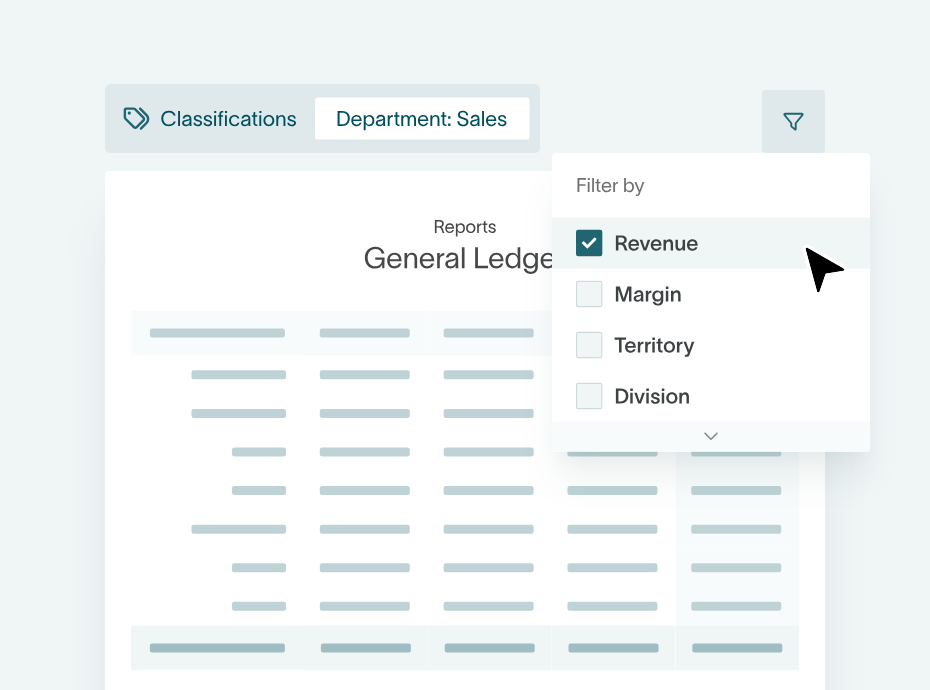
Dynamic reporting
Drag-and-drop your way to the ideal custom reports. Turn standard income statements into targeted analyses by project, region, or entity. Isolate revenue accounts or combine operating expenses for more focused analysis.
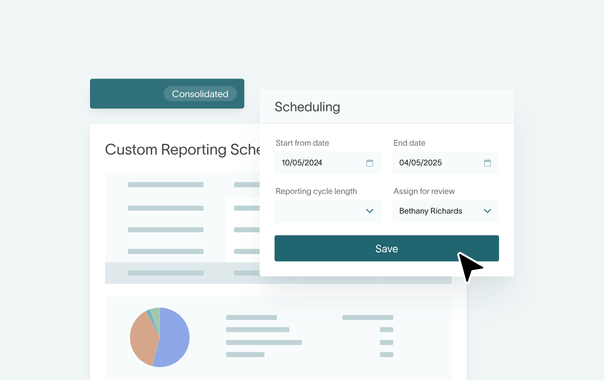
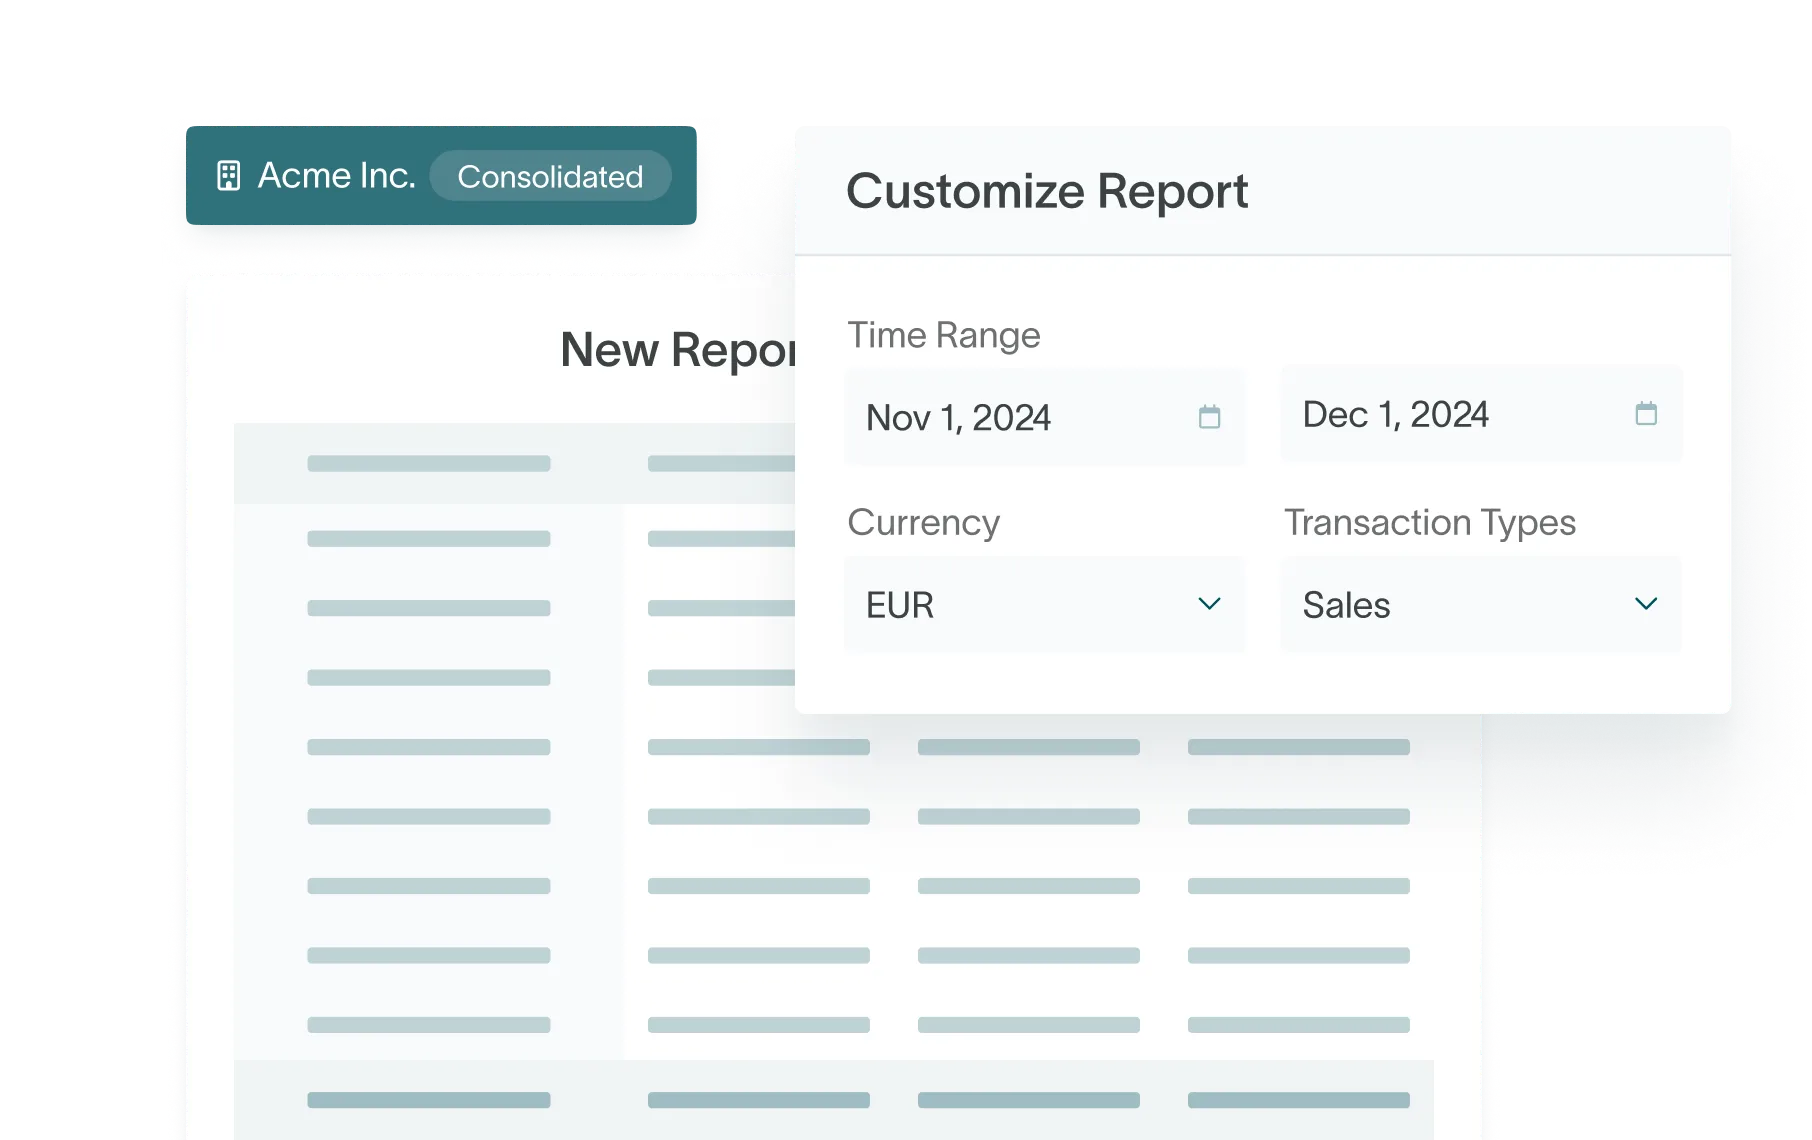
Flexible accounting periods
Adapt reporting periods with custom accounting calendars. Whether you run on a standard calendar year or a 4-4-5 reporting schedule, easily generate consolidated views and calculate KPIs like gross margin and operating income.
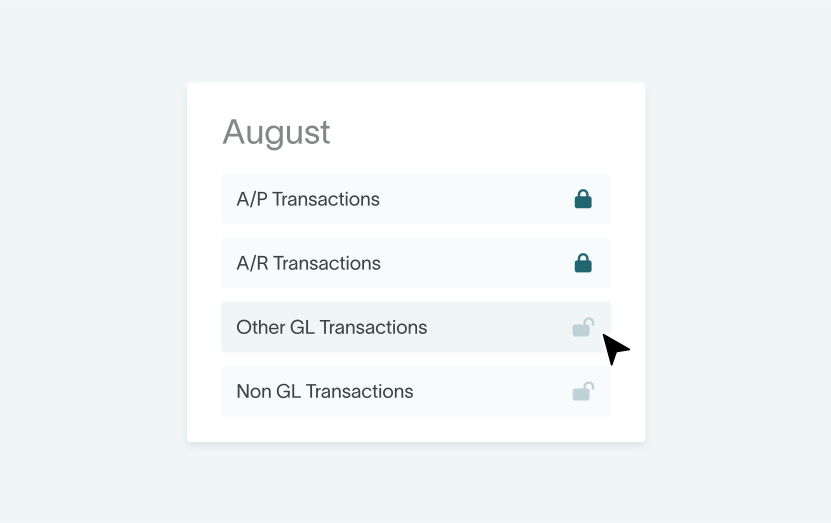
Airtight data control
Maintain data integrity with period-end controls and comprehensive tracking. Period locking blocks unauthorized changes during reporting periods, with built-in audit automation and detailed audit trails ensuring transparency.
Unlock advanced analytics
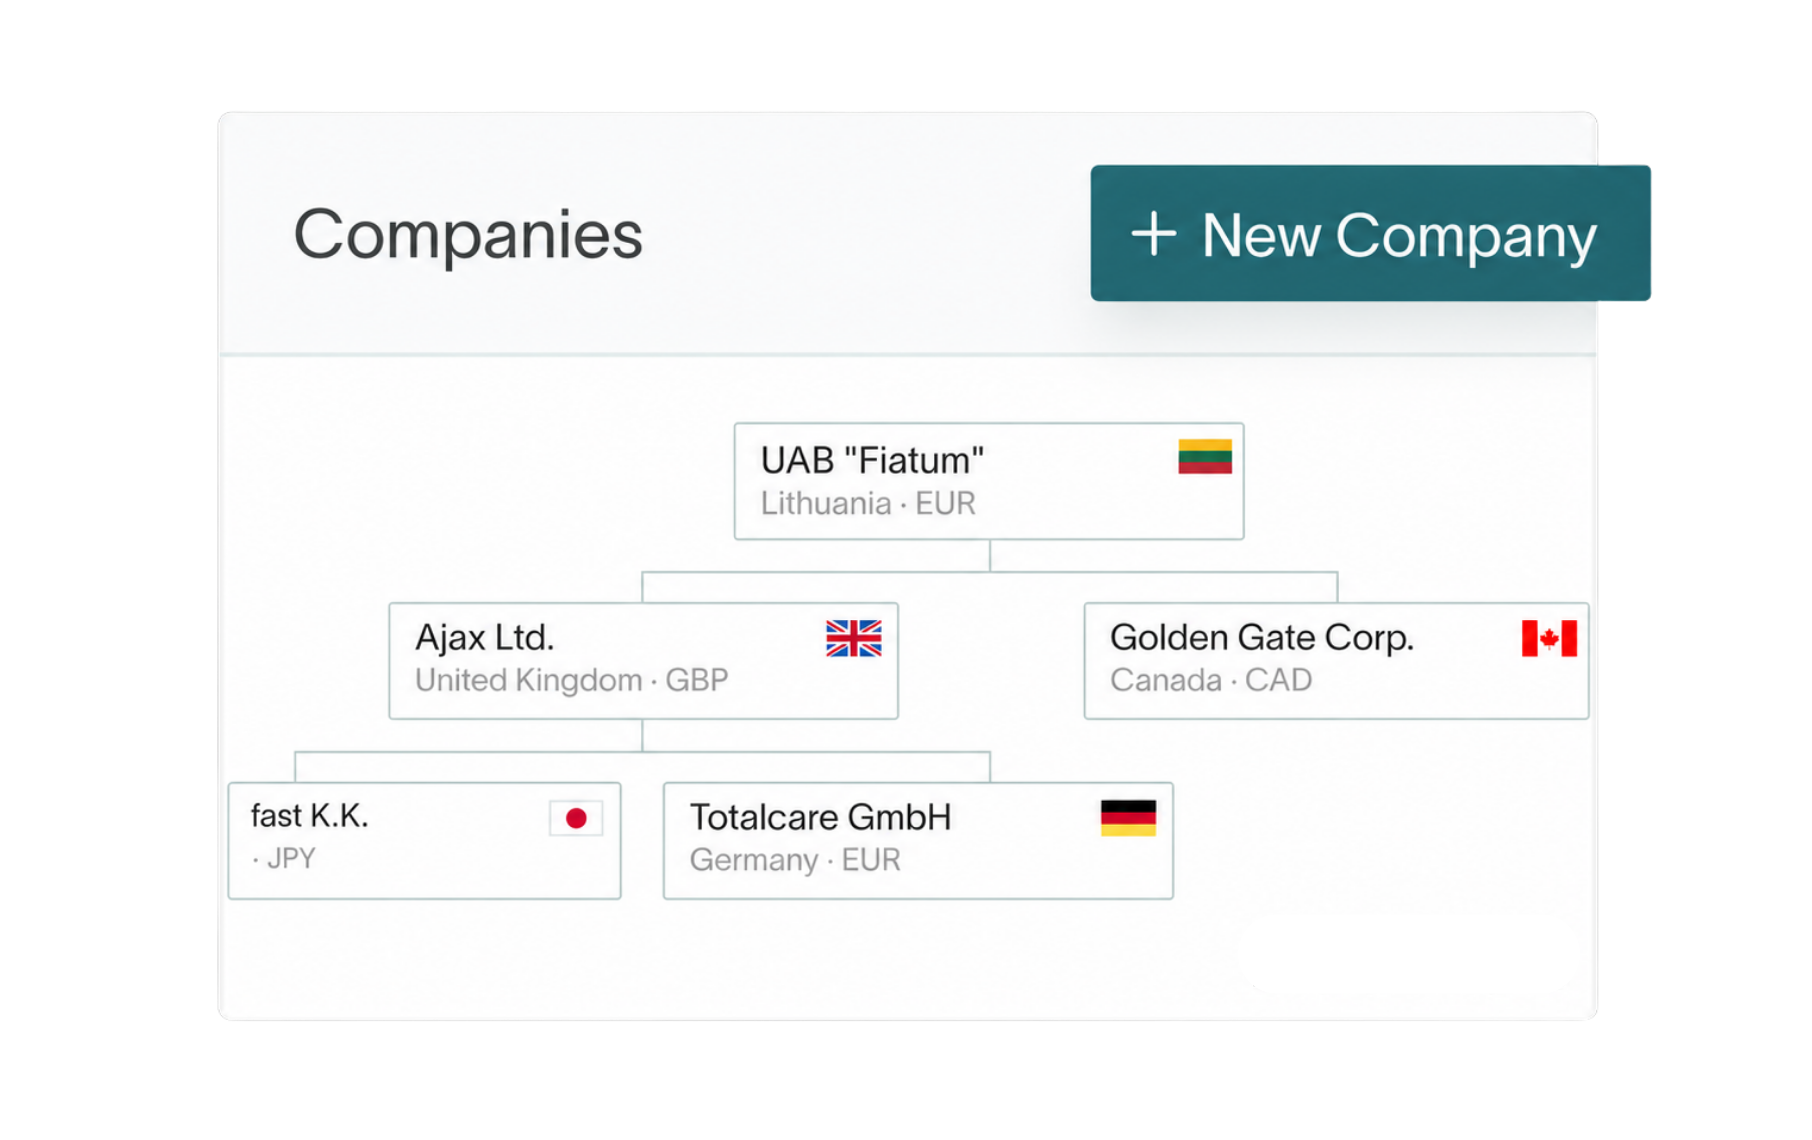
Multidimensional analysis
Map performance across unlimited custom dimensions. Connect organizational characteristics to transactions for granular analysis of revenue, margins, and operational metrics across divisions, territories, channels, and entities using multi-entity accounting.
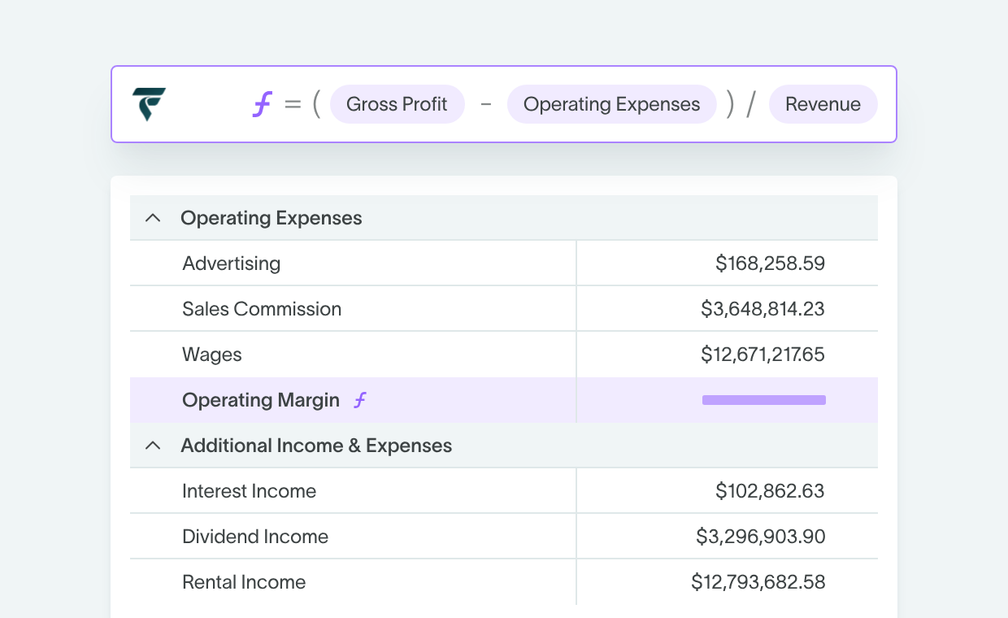
Automated metrics
Calculate operating margins and core metrics with flexible account groupings. Set and forget these recurring calculations, putting manual spreadsheet edits in the past.
Smooth Excel integration
Explore your financial data through Fiatum’s native Excel integration. Build dynamic models with custom formulas. Access detailed line-item data and coding details for precise month-end reconciliation through automated account reconciliation.
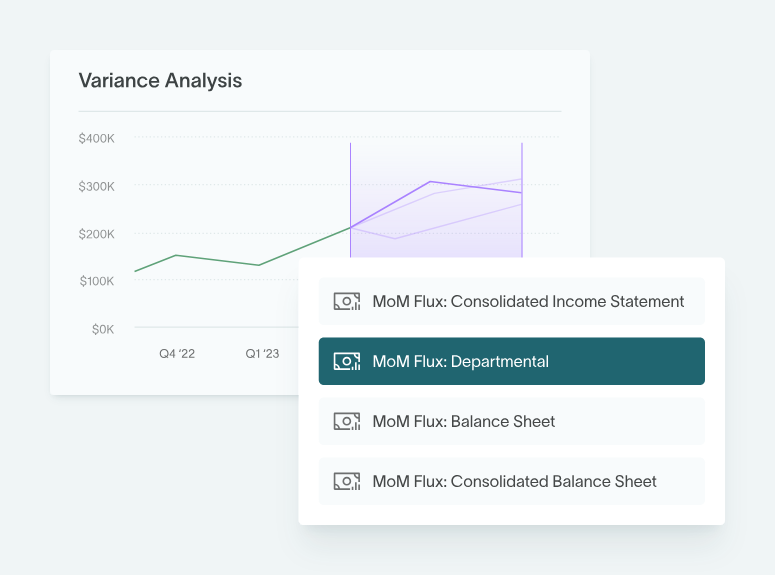
Flux analysis
Set up automated flux analysis as part of a structured close management process, with custom thresholds and assignment workflows. Automate recurring, period-specific reports, complete with due dates and detailed variance explanations.
Get insights that go beyond the numbers
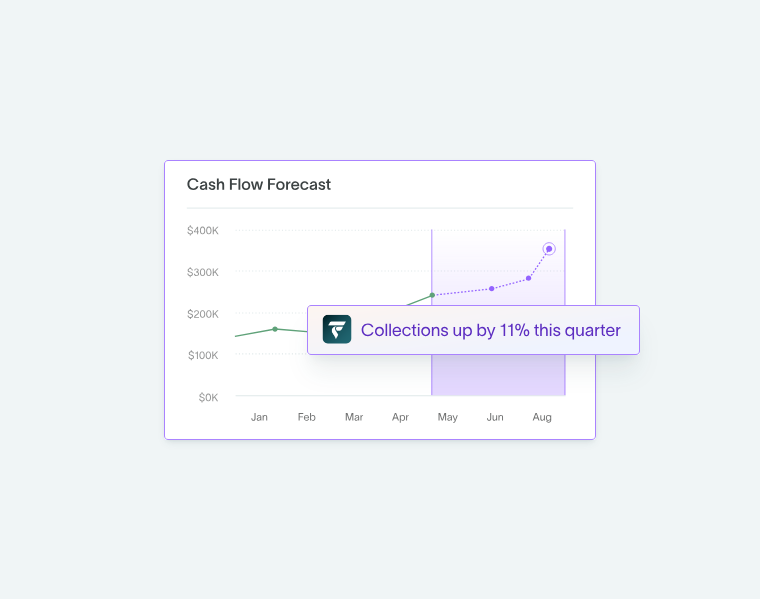
Leverage AI-generated analysis and forecasting to enhance your team’s accuracy and strategic planning. Uncover patterns and predict future performance so you can make informed, confident decisions.
Achieve precision with custom categories and AI-powered report generation. Use custom filters to drill reports down to the most granular level, unlocking deep insights that are specific to your enterprise’s needs.
Accurately assess financial risks with AI-driven insights into period-over-period trends and adjustments to line items. Access real-time analysis of key metrics – from profitability to annual recurring revenue – to ensure compliance.
Get high-level report snapshots with direct links to granular data through customizable dashboard widgets. Enable team members to monitor their key financial metrics through personalized summary views without navigating multiple reports.
Transform raw financial data into compelling business stories with Fiatum AI’s narrative creation. Seamlessly integrate financial statements, visualizations, and explanatory text to provide stakeholders with thorough, context-rich reports.
Financial reporting software FAQ
Balance sheet
The balance sheet is a snapshot of your company’s financials at a specific time. The balance sheet shows all assets, liabilities, and equity. In essence, what your company owns and owes.
Income statement
The income statement report is used by finance teams to track revenue, expenses, and net income at a specific timeframe.
Cash flow statement
The cash flow statement shows your finance team how cash moves in and out of the business. This is analyzed by operations, investing, and financing.
Statement of shareholder equity
This statement explains changes in equity during a given period. This includes retained earnings, stock issuance, and dividends.
While Excel is widely used for financial reporting, it’s not a dedicated financial reporting system.Many teams still rely on spreadsheets to build reports, track metrics, and close the books, especially in the early stages of a business.
A true financial reporting system does way more than Excel. It pulls live numbers directly from your ERP system — powered by an integrated general ledger — automates calculations, and ensures consistency across reports. Learn more about the role of the general ledger in ERP systems. Modern, AI-driven financial reporting software like Fiatum goes even further by combining real-time data with AI-driven insights – so you can safely predict what comes next.
The best financial reporting software depends on your company’s and financial team’s needs.
But no matter the needs, you should definitely look for a financial reporting with real-time data, clean audit trails, and flexible reporting options.
For mid-market finance teams, Fiatum is the best option because it offers many features legacy ERPs and financial reporting software don’t have. Live reports across AP, AR, cash flow, and the general ledger, with custom dashboards, AI-powered insights, and role-based views are just a few of the features that make Fiatum stand out.
Finance teams often assess reporting flexibility, real-time visibility, and audit support using a documented ERP evaluation checklist to ensure requirements are met across vendors.